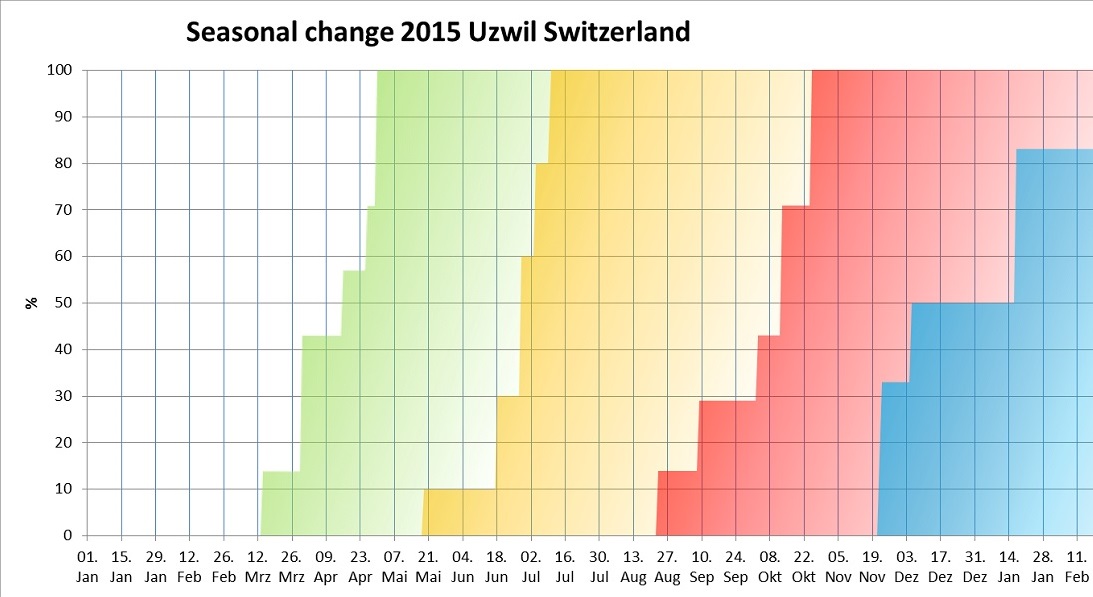
SIMR visualization for 2015/16. According to my indicators it shows the progressive arrival of the seasons: spring = green, summer = yellow, autumn = red and winter = blue. It will be interesting to compare this site with other years and with other places in different latitudes. Winter attained 83% so far - the peak of winter is in the first week of February according to the standard diagram. My last indicator for winter is "cold surge from east" - I wonder whether we'll get that at all.