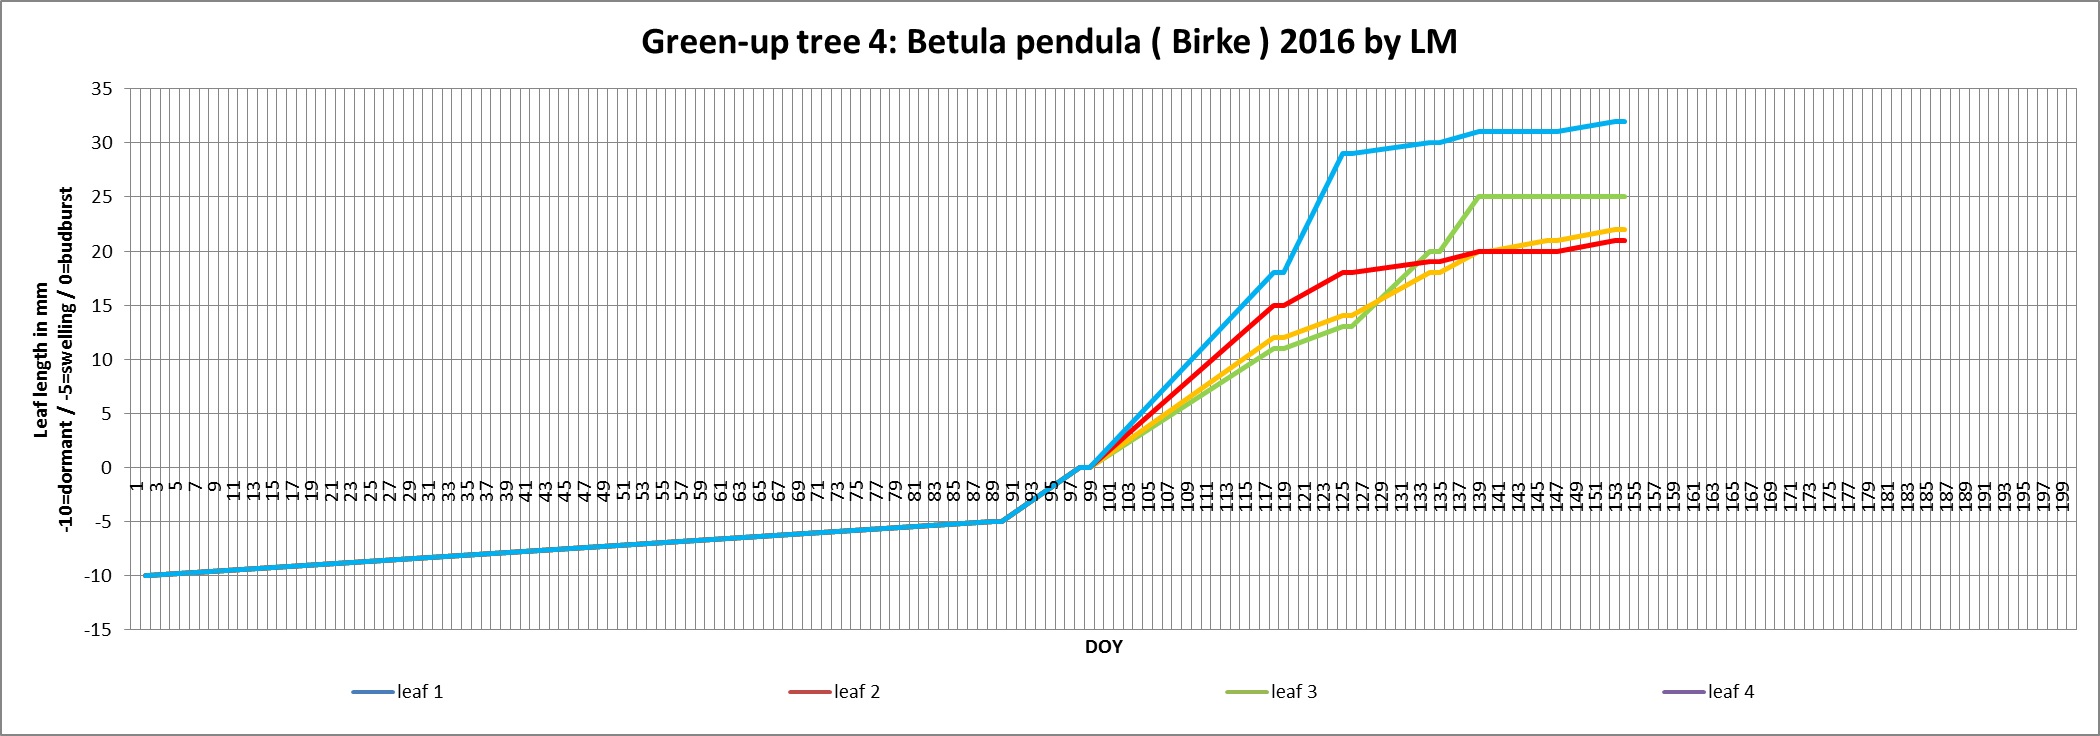
I have drafted a diagram to visualize our green-up observations. It allowes my students to get a visualization immediately: It works with an excel calendar you can type in your observations whereupon the diagram is updated immediately. I decided to enter the state of the buds as negative values, -10 meaning "dormant", -5 meaning swelling and 0 meaning "budburst". This allowes to illustrate also the development before you can measure leaf length. I think it isn't difficult to understand. So the buds on this birch tree branch opened on day 98 = April 7th. It shows that leaf 4 was always the longest leaf, whereas leaf 3 was the second longest at first, but is the shortest now. All the leaves don't grow much any more, leaf 1 seems to have stopped growing. (There is an error with the colors in the legend.)