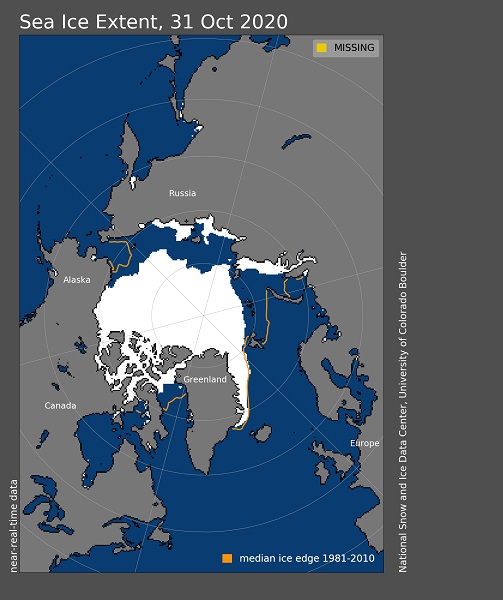
October 31st, 2020: Arctic sea ice extent ***********************
Lingering seashore days (October 5, 2020)
Following the sea ice extent minimum on September 15, 2020, expansion of the ice edge has been most notable in the northern Chukchi and Beaufort Seas. The ice edge along the Laptev Sea continued to retreat farther. Antarctic sea ice has climbed to its highest extent since 2014; it may have reached its maximum on September 28, but it is too soon to say for sure.
Overview of conditions
Arctic sea ice extent averaged for September 2020 was 3.92 million square kilometers (1.51 million square miles), the second lowest in the 42-year satellite record, behind only September 2012. This is 350,000 square kilometers (135,000 square miles) above that record low, and 2.49 million square kilometers (961,000 square miles) below the 1981 to 2010 average. Following the minimum seasonal extent, which occurred on September 15, ice growth quickly began along in the northern Beaufort, Chukchi, and East Siberian Seas (Figure 1). Expansion of the ice edge was also notable within the East Greenland Sea and within Canadian Arctic Archipelago. By contrast, the ice edge in the Kara and Barents Seas remained relatively stable until the end of the month when it started to expand, and within the Laptev Sea the ice edge retreated slightly. The Northern Sea Route remained open at the end of September whereas the Northwest Passage southerly route (Amundsen’s route) is now blocked by ice. Ten days after the minimum extent was reached, the total extent climbed above 4 million square kilometers (1.54 million square miles) and by the end of the month the ice extent was tracking at 4.25 million square kilometers (1.64 million square miles), still second lowest in terms of daily extent.
Conditions in context
Arctic air temperatures at the 925 hPa level (about 2,500 feet above the surface) remained overall above the 1981 to 2010 average during September. This warmth was primarily observed on the Eurasian side of the Arctic, where air temperatures along the coastal regions of the Laptev Sea reached up to 8 degrees Celsius (14 degrees Fahrenheit) above average. Below average temperatures prevailed over Greenland. Warm conditions over the Siberian side of the Arctic were driven by a strong high pressure ridge over Siberia coupled with a strong low-pressure trough centered over Svalbard. This is also manifested as a positive phase of the Arctic Oscillation (AO). A cyclonic (counterclockwise) circulation pattern set up over the Laptev Sea, bringing in warmer air from the south. At the same time, this circulation pattern enhanced ice drift out through Fram Strait and out of the Arctic Ocean. Winds from the south in the Kara and Barents Seas also kept the ice edge from expanding in that region, and led to retreat of the ice edge within the Laptev Sea.
Image courtesy of the National Snow and Ice Data Center, University of Colorado, Boulder (https://nsidc.org/arcticseaicenews/). Data source see http://nsidc.org/arcticseaicenews/about-the-data/